Features
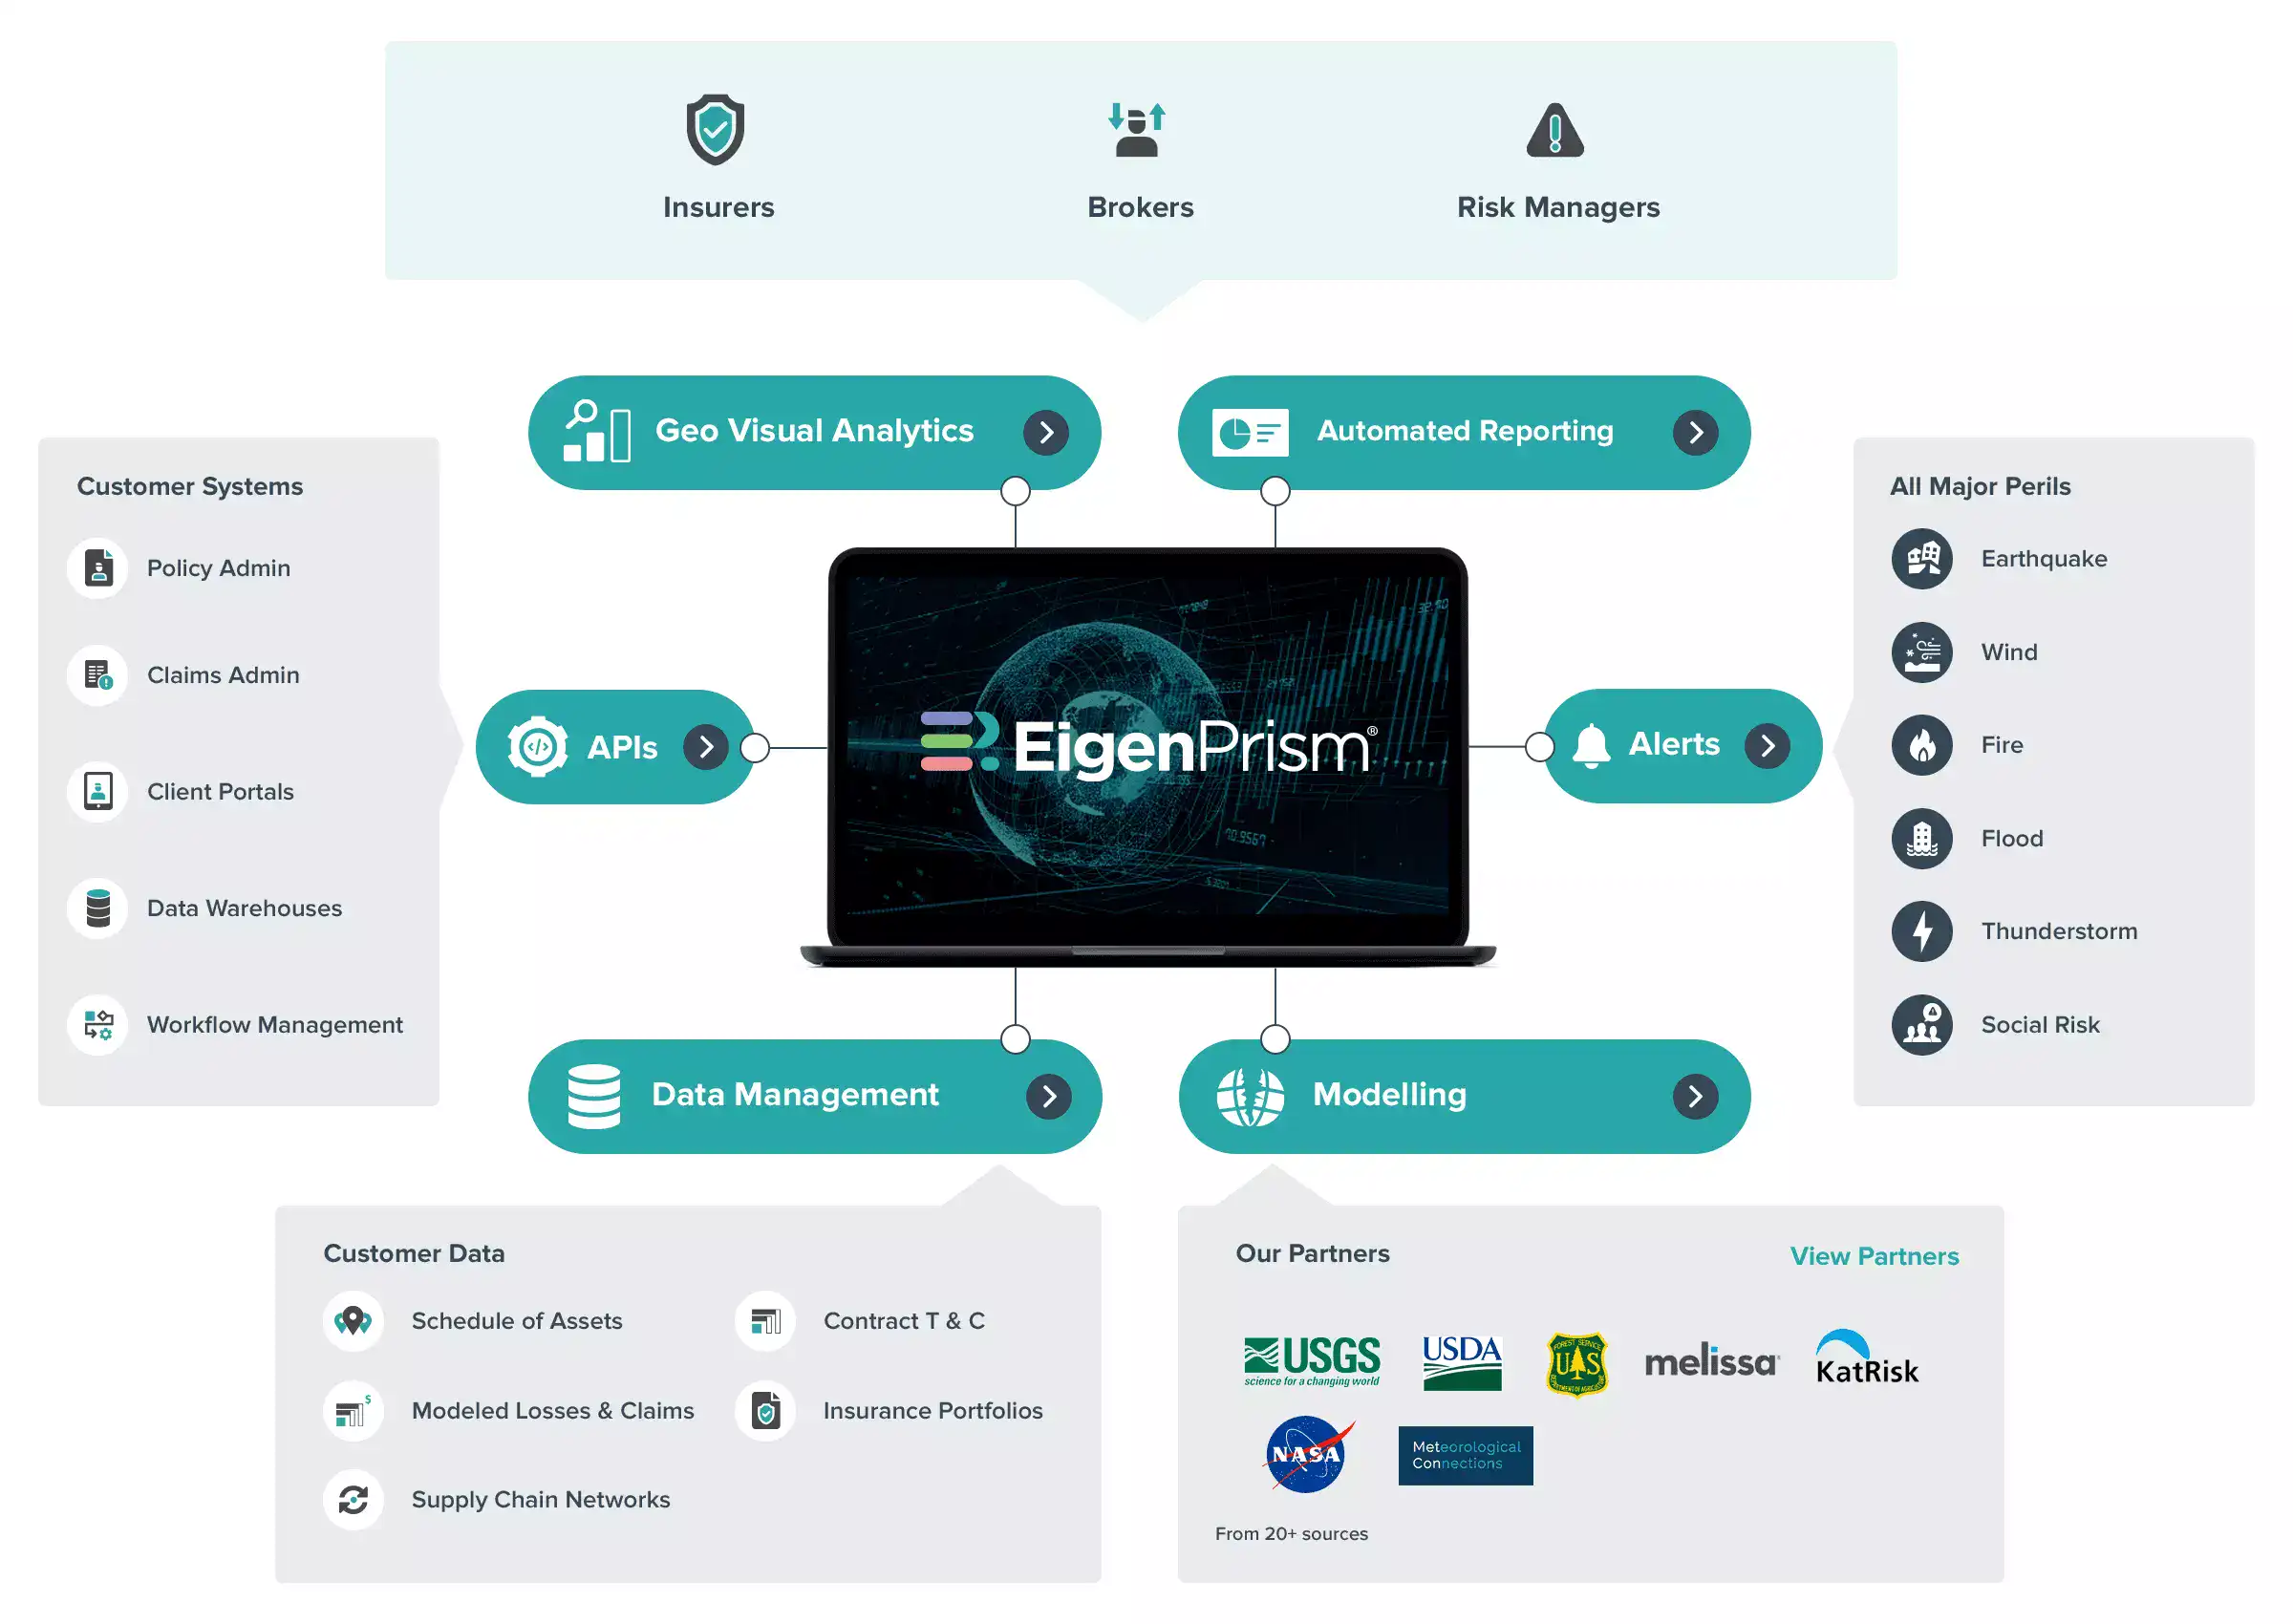
We have built our own proprietary engine capable of mapping millions of records, together with traditional dashboards and complex modeling calculations including geospatial lookups, damage functions and complex financial payout calculations.
All this happens quietly (and fast) behind the scenes, so you can focus on generating powerful insights effortlessly.
Our users love this feature so much, we had to give it a cool name!
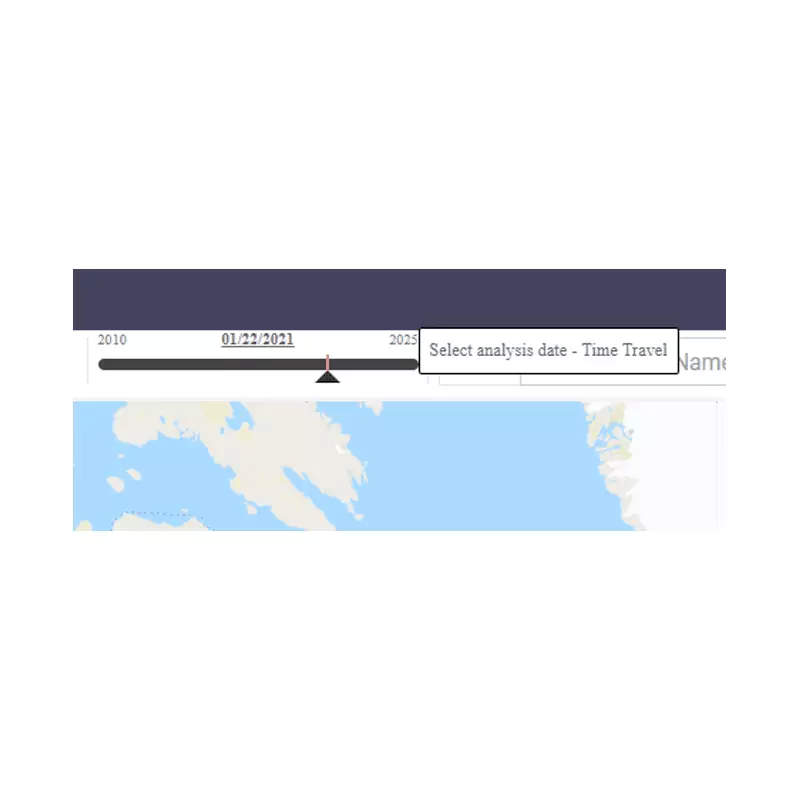
Our data model inherently understands the concept of time, so you no longer need to work with static snapshots of your data. Gone are the days of comparing year over year snapshots – you can now update your data in our system dynamically (read about our – dynamic exposure management feature here) as and when it changes. You can then visualize historical, in-force and forecasted exposure views on the fly, and assess exposure changes between any two dates including heatmap visualizations.
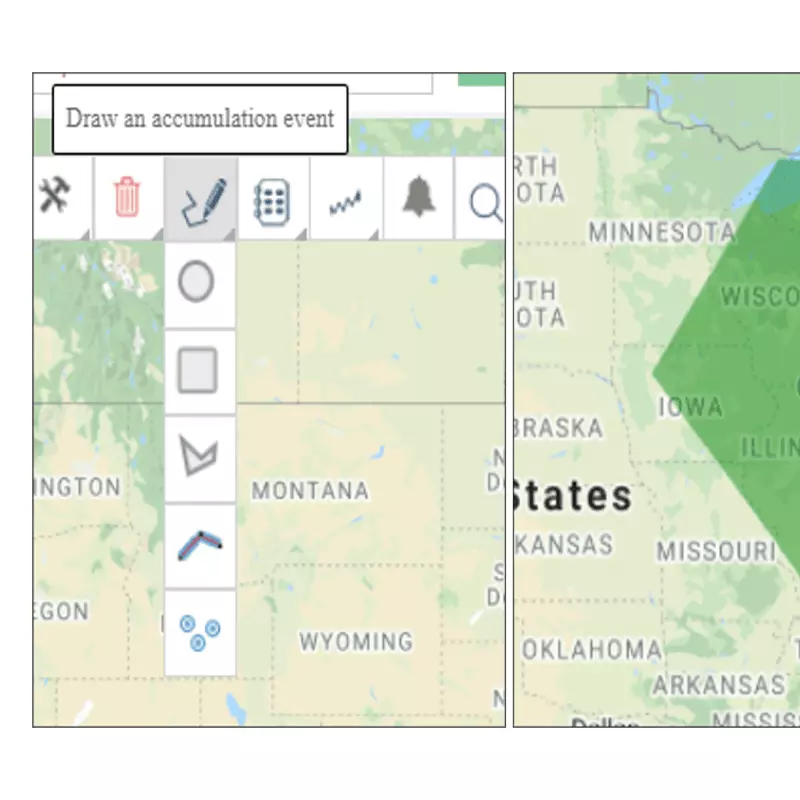
With EigenPrism, identifying unforeseen accumulations is a breeze. Of course, you can draw a shape on the map and determine your exposed values. But our integrated financial modeling engine means that you can instantly compute your exposed limits as well. Also, the speed of our engine lets you move the shape around to instantly recompute your results.
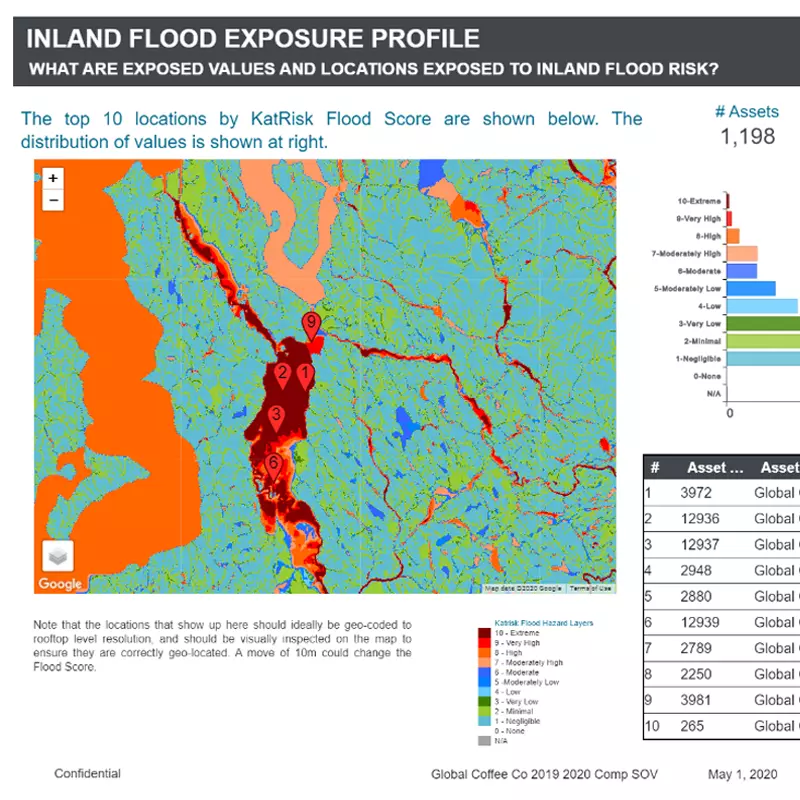
And that’s just the beginning! Our spider analysis engine automatically finds your top hotspots across millions of locations globally, while the portfolio impact engine (also available as an API) lets you proactively determine breaches of portfolio accumulation thresholds from new accounts.
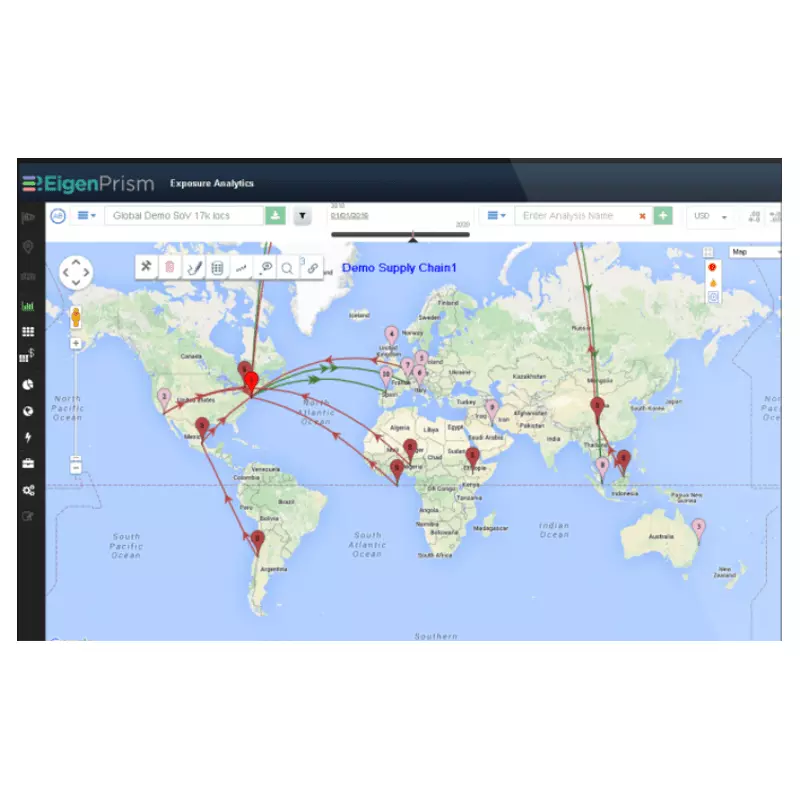
If you are trying to assess risks to your supply chain, EigenPrism’s network analysis feature lets you capture and visualize relationships between assets, including suppliers and consumers. You can now assess the impact of disruption to any component of your supply chain, to any product or brand. The analytics engine smartly recognizes complex metrics, such as sales contribution, that require special consideration when aggregating.
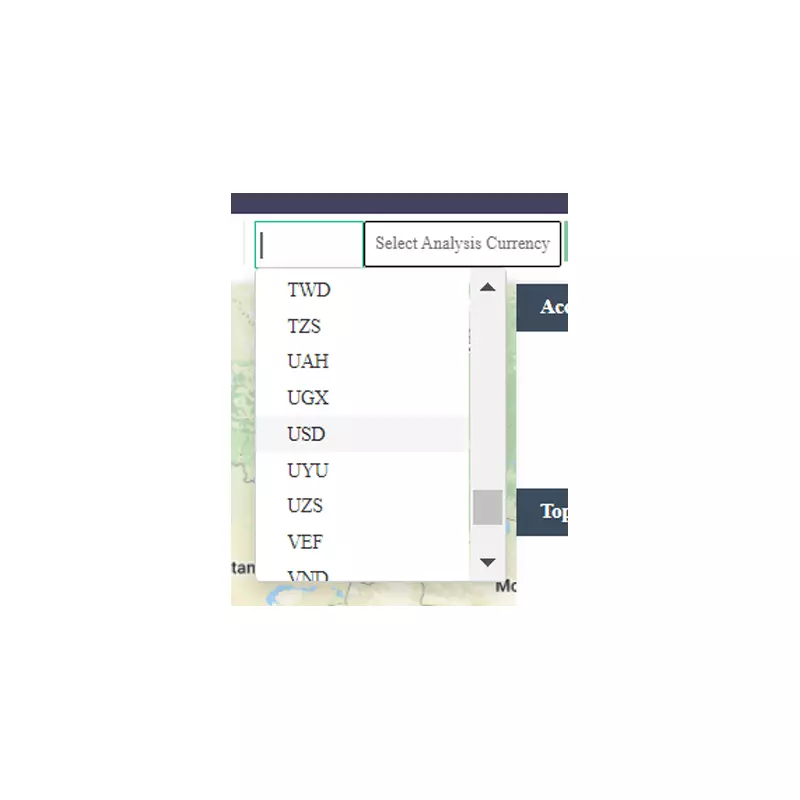
Got an international book of business? Not a problem!
You can enter your data in its native currency, and pick any currency for analysis. We will automatically select the appropriate conversion factor based on your analysis date, and return results in one consistent currency, with all financial calculations properly handled.
Clients Speak
-
Chief Claims Officer, Velocity Risk Underwriters
"Prior to EigenRisk we had a competitor's product which was very much like a cookie cutter project...working with EigenRisk made it easier to get a product that really spoke of what we do and was able to meet our needs, basically EigenRisk did a wonderful job for Velocity."
-
Catastrophe Analytics Team Lead, Velocity Risk Underwriters
What it does is, to digest information, and apply it in a different way, which we probably haven’t done before.
-
Catastrophe Analytics Team Lead, Velocity Risk Underwriters
Having the ability to get an estimate real quick about our exposure, having the ability to quickly send out adjusters to the areas we need to send our adjusters to, helps us do our job better.
-
Catastrophe Analytics Team Lead, Velocity Risk Underwriters
Having a platform like EigenPrism that has the information ready to go at a moment's notice really enables us to stand behind our name.
-
Catastrophe Analytics Team Lead, Velocity Risk Underwriters
EigenPrism can transfer our data and our exposure into a format that the system can consume so that we can get our data and information out of the platform.
-
Chief Claims Officer, Velocity Risk Underwriters
It has brought huge impact and benefited our customers in a great way to get their lives back on track after a major CAT event.
-
Chief Claims Officer, Velocity Risk Underwriters
The thing that EigenPrism really does for us is that it gives us a glimpse into the crystal ball of future and have an idea of what's coming our way so that we can get the right plans in place and give our customers what they need at the time of their need.
-
Chief Claims Officer, Velocity Risk Underwriters
It's great to have a vendor who you see as an extension of your business.
-
Chief Claims Officer, Velocity Risk Underwriters
You get a very realistic view of what your portfolio is exposed to. A lot of other products out there give you your total insured value that is exposed and it gives a very distorted view of what is impacting your portfolio.
-
Chief Claims Officer, Velocity Risk Underwriters
The ability to see your portfolio being impacted around all of your risk, across the country, is extremely important to us. It helps us have an insight on how to deploy resources from a claim's perspective.
-
Chief Claims Officer, Velocity Risk Underwriters
I used to use the phrase 'mind the store while we were away'- so I wanted something that would tell us when risks were exposed to certain type of perils, which would not only help us with the major cat events but also small.
-
Chief Claims Officer, Velocity Risk Underwriters
One of the huge things with EigenRisk was to get down on the large commercials down to applying their correct coverages for the events that were happening and applying the deductibles.
-
Property Practice Leader, Lockton
The difference between pre-Eigen and post Eigen has been our ability to put some thought around how to visualize the client’s aggregate catastrophe or weather-based perils and show the client visually on the screen how their accumulation of risk is affected by that particular peril.
-
EigenAlert has enabled us to timely inform our clients when their particular asset is in line of a weather event. This gives them the opportunity to reach out to their facility, post a major event, to assess the damage to property or lives.
-
Property Practice Leader, Lockton
"We used EigenAlerts during some major hurricanes which resulted in us winning a few clients."
-
Property Practice Leader, Lockton
Data visualization capability at the time was the most innovative in the industry
-
Property Practice Leader, Arthur J Gallagher
The fact that we can augment data, improve our client's data, and identify data weaknesses is a positive.
-
Property Practice Leader, Arthur J Gallagher
Our clients are global, and EigenRisk has helped us to be more on top of issues that are presented to them on a daily basis.
-
Property Practice Leader, Arthur J Gallagher
"Before EigenRisk, we relied on excel spreadsheets. EigenRisk has automated that to the point that you can be anywhere in the world, anytime in the day, and continue to get notifications of events and so from a time management standpoint, it has been a real game changer."
-
Property Practice Leader, Arthur J Gallagher
We were bombarded with 3 devastating storms, Harvey, Irma and Maria and there were also a couple of Earthquakes in between, but we were able to get our clients information pre-loss and post-loss, quicker than we have ever been able to do before.
-
Property Practice Leader at Arthur J Gallagher
The ease of use of the platform- the fact that we could put this tool into the hands of the broker working directly with the client, that it didn’t sit with an analytics team, and the fact that it had a 24hr/ real-time alert feature was a real key selling point.
-
P&C Insurer
EigenRisk’s product enhancements are rapid and customer response is also quick.
-
P&C Insurer
"Because we have set up APIs and bring data from our production systems into EigenPrism on a daily basis, we can see where we are growing and where our exposure concentrations are hitting up against the limits that we have established."
-
P&C Insurer
We can sleep peacefully knowing that there is a way for us to monitor our exposure to catastrophes.
-
P&C Insurer
Prior to licensing EigenRisk, we used to shut down an entire region or states for new business, before a landfalling hurricane or for that matter, Wildfires. Now, with surgical precision, we can identify smaller areas or regions to shut down business while the rest of the state can continue to be open.
-
Managing Partner, Alesco Risk Management Services Limited
EigenPrism is not a black box. There is a process through capture of data to application of historical events and natural catastrophe zones and the interpretation of how those events create damage. EigenPrism has a powerful damage function that can be customized for particular assets. In our case we have used it heavily for energy operations, so offshore wind farms for example, or offshore platforms, we can build a customized damage function for that specific asset.
-
Managing Director, Real Estate and Hospitality Practice, Arthur J Gallagher
One of the largest owners of single-family homes in the US, and they were just mesmerized by how efficient and how on-point the EigenPrism results were.
-
Analytics Manager at top 10 Broker
...I asked how long it would take for the office to create an Excel data profile comparing year-over-year changes in TIV, and they said “at least 2 hours”. This came from someone who is very organized and good with Excel. They were ecstatic that Eigen Profiles only takes a single button click and about 2 minutes to automatically generate the comparative reports and maps. This could be a significant time saver for the team while producing a better work product.
-
Risk Manager for Top Auto Retailer
...I wanted to let you know the report related to hail at each of our stores has been invaluable! It was very well received in London by our insurance underwriters, and the report has formed the foundation for our capital plan for adding hail tents to 33 stores that, according to your analysis, fall into areas of high risk.
-
Analytics Manager at top 10 Broker
I'm sure you've heard about the Montana EQ. While it doesn't appear to be devastating, it's an excellent example of how quickly the Prism notifications are generated. The below notification was automatically sent at 2:04 AM this morning, about 15 minutes after the event. Quite impressive.
-
National Analytics Practice Leader, Lockton Companies
Lockton leverages the power of EigenPrism to make our clients' businesses better in the face of disaster.
-
We needed the latest in risk analytics to empower and inform timely decision making, both for ourselves and for our clients.
Managing Partner, Alesco
-
Managing Partner, Alesco Risk Management Services Limited
The EigenRisk team share our passion for leveraging advances in risk analytics to really empower and inform timely decision-making, whether our own, our clients or that of our markets, and we’ve been impressed by their collaborative approach. EigenPrism addresses a gap in the market for large corporate and multinational accounts which require an efficient and timely analysis of their exposure to natural catastrophes and we look forward to working with the team.
-
Analytics Manager
Prism is the idea front end analytics platform, empowering real-time property analytics packaged in an intuitive format. Using Prism, we engage with clients in an interactive manner to optimize and tailor their insurance program, while also responding proactively to loss events anywhere in the world.
-
Area Senior Vice President, Arthur J. Gallagher & Co.
EigenPrism feels real. You can interact with your data. It's not a static exercise of managing spreadsheets. You can have a relationship with the data and the models.
-
Area Chairman, Arthur J. Gallagher & Co.
We are now able to help our clients visualize and model their exposure to CAT loss from an extensive library of historical footprints; not just what the ‘closed box’ models give us. Notably, we can develop ‘what if’ scenarios to loss, enabling us to alert our clients of potential losses to impending and real-time events. In turn, that will help facilitate faster and more focused responses.
-
EVP & Head of U.S. Property Practice, Lockton Companies
We have seen first-hand how the [EigenPrism] platform enables our brokers and consultants to analyze catastrophic property exposures by individual client locations faster and with greater precision. This facilitates more effective post-event planning, response and claims management, as well as enhancing our ability to better prepare our clients for their insurance renewals.
Watch Testimonials
Request Demo